 8.1 The proportionalist view of probability
The problems considered in observational stochastics are phrased most naturally in terms of proportions rather than probabilities. For example, practitioners are typically concerned with the proportion of time a server is busy rather than the probability a server is busy. Similarly, practitioners are typically concerned with the proportion of packets that arrive when a buffer is already full rather than the probability of a buffer being full when a packet arrives.
This chapter examines the use of proportions in contexts where the passage of time is not an integral element of the original problem, and where problems are phrased most naturally in terms of questions that begin with “what is the chance” or “what is the likelihood.” Note that the validation paradigm described in Section 1.2 is not directly applicable to such contexts since there are no time-dependent trajectories to observe. Instead, there are only static populations. In this context, intuitive concepts such as chance or likelihood become meaningful and measurable when linked to directly observable proportions of these populations. As in the case of observational stochastics, the structure of these populations is typically characterized through loose constraints rather than probability distributions and the sampling premise.
The next few sections illustrate how this proportionalist view can be employed to formalize and analyze questions that are expressed using ordinary non-technical terms such as chance or likelihood. As usual, a series of simple examples will be used to illustrate fundamental principles and concepts that extend broadly.
8.2 A medical test and its implications
 This example, which is adapted from Example 2.10 in (Kobayashi, Mark and Turin 2012), concerns a medical test that is used to diagnose a particular disease. The original statement of the problem begins as follows:
“The following information is known about this disease and its medical test.
- For a person with this disease, the test yields a positive result 99% of the time and a negative result 1%.
- For a person without this disease, the test yields a negative result 99% of the time and a positive result 1%.
- 1% of the population is infected by this disease and 99% of the population is not.”
Note that Assumptions 1, 2 and 3 are expressed in terms of relationships among observable proportions of a population. Their meaning can be understood, quantified and verified without referring to abstract entities such as sample spaces, events, probability measures and random variables.
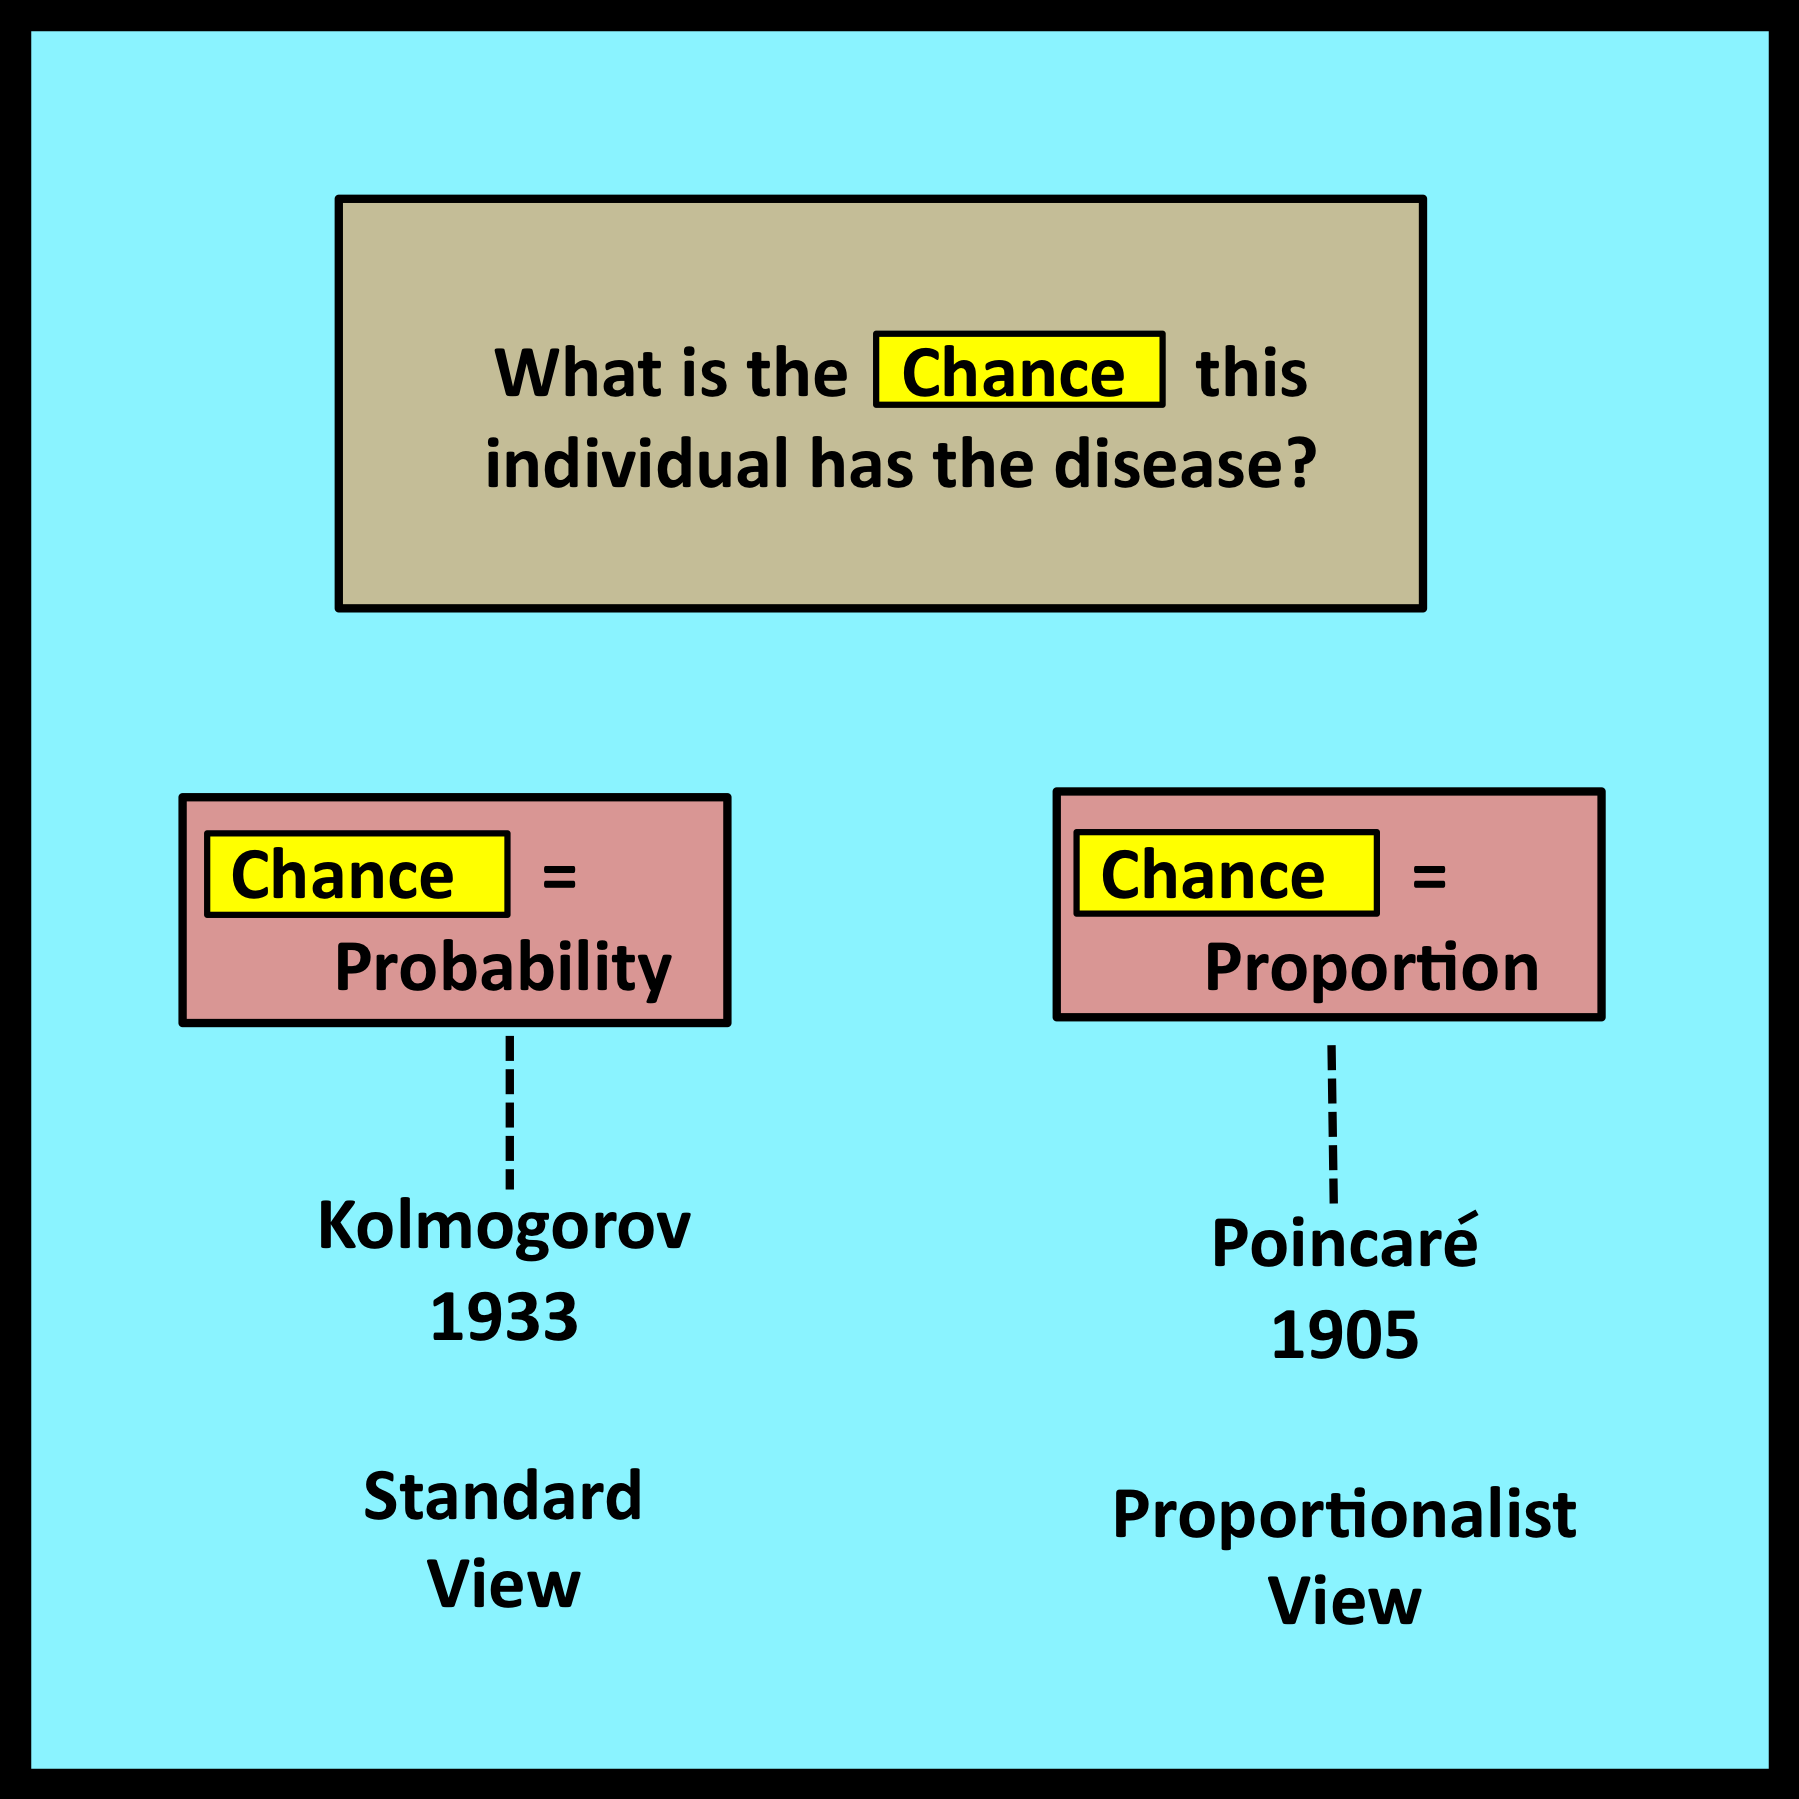
The example continues by assuming that an individual has taken the test and obtained a positive result. In other words, the test indicates that this individual has the disease. However, it is possible that the individual is perfectly fine, but the test has produced a false positive. Alternatively, it is also possible that the test is accurate and the individual is indeed ill.
Within this context, Kobayashi, Mark and Turin propose the following question: “What is the chance” that this particular individual has the disease?